White MAThis modified indicator just based on my 2cent strategy & experience,
which is:-
MA6, MA20, MA50, MA200
However, I always turn off MA20 since I also use BB (20) indicator.
Generally, if small MA cross up big MA, then it becomes entry signal, & vice versa
Each entry signal need confirmation state which is next price should close higher than crossing price.
If price close lower than crossing price, then it will be invalid entry's signal,
while if price keep maintain at same value, then it's mean uncertain for me until it close whether above or below crossing price.
"Strategy 1" (General)
In TF1D, the pattern should fulfill my condition as below:-
- MA20 above MA50 (bullish uptrend)
- Price pullback at least touch MA20 for reversal (making Higher Low)
- Price break resistance of pullback's price
My entry signal only after it close above the resistance, near "support" (RBS, Resistance become Support)
My stop-loss, if and only if price touch previous SMA6 price (or SMA10)
Unfortunately, I haven't had any specific target price. It's depending on what kind of "player" you are. (achievement)
Few TPs those I used:-
- Price touch my Static Resistance on chart obtained from,
~ Pullback price
~ Fibo (1.61++)
~ Higher price in 3 months, 6 months, 1 year, 3 year, and so on. (road to ATH, All Time High)
- Price close outside Upper BB (Dynamic Resistance)
I don't assume sell signal by using crossing indicator as TP, it's more to stop-loss for me. (means stop from loss your profit)
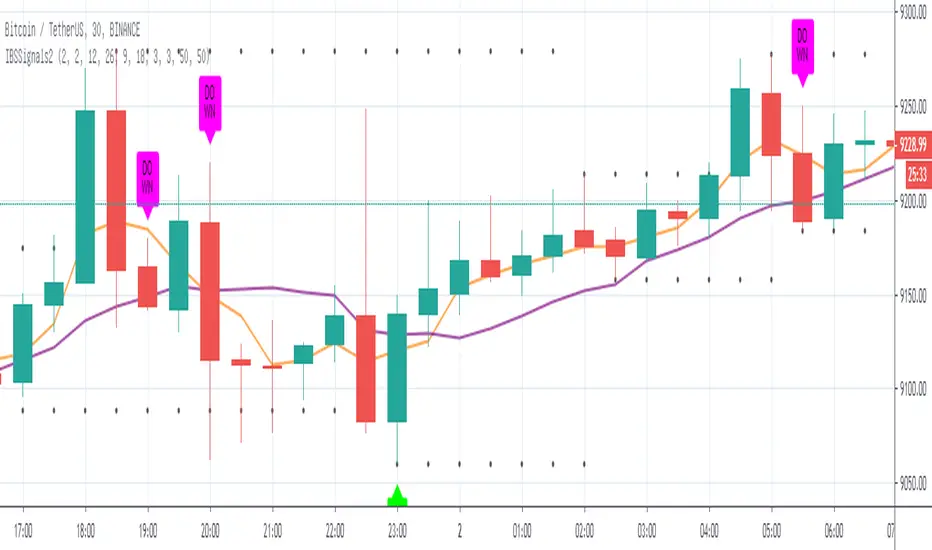
"Strategy 2" (Reversal Entry)
In TF15 minutes, we are assuming entry signal when SMA6 cross up SMA50. However, it's still need confirmation by next closing price.
This strategy can be apply in TF1D although SMA20 doesn't cross up SMA50 yet.
That's all my sharing strategy/system based on my 2cent experience, it's not a prefects strategy but I hope it will gives some idea for you guys in order to obtain your own system.
在腳本中搜尋"ma cross"

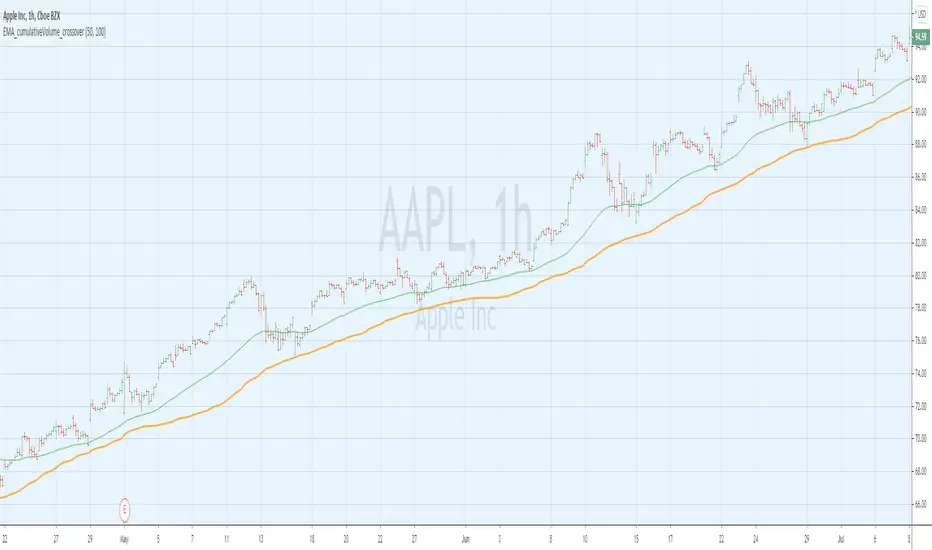
EMA_cumulativeVolume_crossover [indicator]while I was doing some research with exp MA crossovers and volume indicator , I have noticed that when ema 50 is above cumulative volume of 100 period , shows to capture nice profits in that trend. Shorting also (ema50 cross down volume of 100 period) also shows nice results.
BUY
When ema50 crossover cumulative volume of 100 period
Exit
When ema50 cross down cumulative volume of 100 period
Short Selling
Reverse above BUY conditions
Back ground color shows blue when ema50 is above cumulative volume of 100 period, shows purple when ema50 is below cumulative volume of 100 period
I will publish the strategy for back testing later today
Warning
For the use of educational purpose only
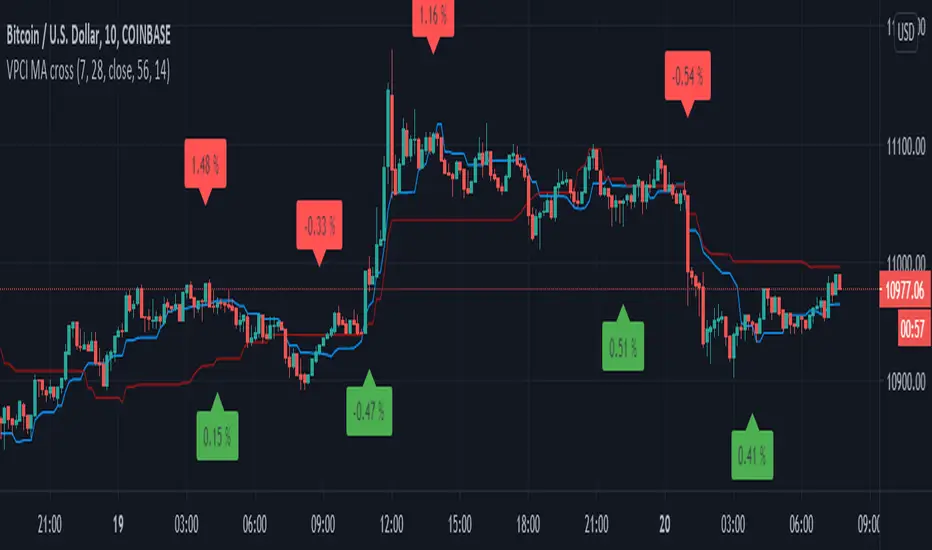
VPCI MA cross [LM]Hello guys,
I would like to introduce you a script that combines two indicators: VPCI( volume price confirmation indicator) and donchian MAs
VPCI:
Fundamentally, the VPCI reveals the proportional imbalances between price trends and volume-adjusted price
trends. An uptrend with increasing volume is a market characterized by greed supported by the fuel needed to
grow. An uptrend without volume is complacent and reveals greed deprived of the fuel needed to sustain itself.
Investors without the influx of other investors ( volume ) will eventually lose interest and the uptrend should
eventually breakdown.
A falling price trend reveals a market driven by fear. A falling price trend without volume reveals apathy, fear
without increasing energy. Unlike greed, fear is self-sustaining, and may endure for long time periods without
increasing fuel or energy. Adding energy to fear can be likened to adding fuel to a fire and is generally bearish
until the VPCI reverses. In such cases, weak-minded investor's, overcome by fear, are becoming irrationally
fearful until the selling climax reaches a state of maximum homogeneity. At this point, ownership held by weak
investor’s has been purged, producing a type of heat death capitulation. These occurrences may be visualized by
the VPCI falling below the lower standard deviation of a Bollinger Band of the VPCI, and then rising above the
lower band, and forming a 'V' bottom.
I have used MA's on top of VPCI and looking for crosses. Percatage that is shown in label is calculation of difference between previous cross and current close price. So you know if you would be flipping what % you would gain or loose, all is rounded with precission of two
DONCHIAN
I took donchain calculation from ichimoku to calculate conversion line and base line(both are giving me information about whether it's trending or not and distance from the mean)
There are various sections in setting:
VPCI - setting of MA lengths(for smaller timeframes I recommend using bigger MA length)
DONCHAIN - setting length for conversion and base line
Any suggestions are welcome
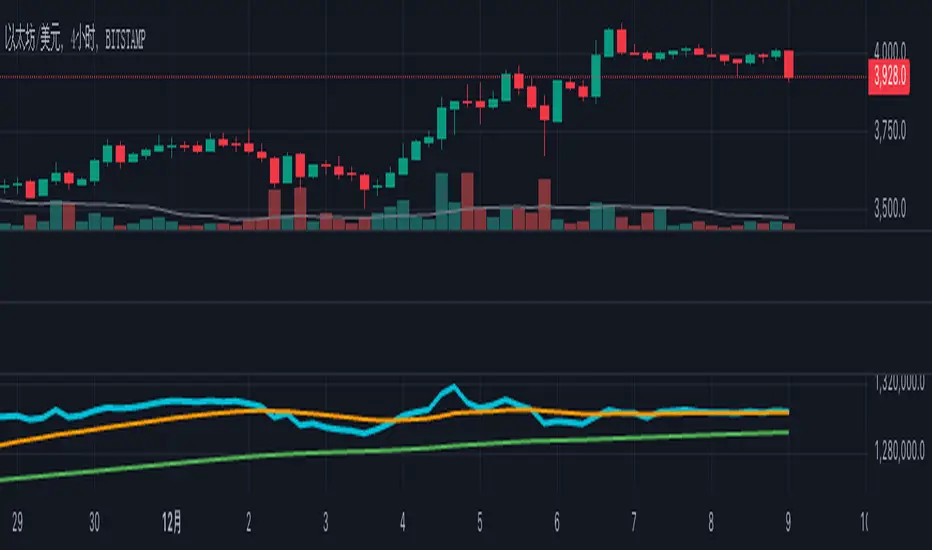
MCDX PlusINTRODUCTION
Upgraded version of MCDX (Add Moving Average) PROTECTED VERSION
This indicator is similar to original MCDX to detect Buyer and Seller momentum based on Price and Volume to detect Buyer and Seller momentum
This indicator helps to detect “Strong Buyer Activities a.k.a Bankers” based on volume and price movement.
HOW TO USE THE INDICATOR?
There are 2 parts . BARs & Moving Average Lines
BARs
RED BAR = POSSIBILITY of BANKER VOLUME
YELLOW BAR = POSSIBILITY of HOT MONEY VOLUME
GREEN BAR = POSSIBILITY of RETAILER VOLUME
Red Bar Increase means Buyer's momentum increases.
Green Increase means Seller's momentum increases.
We focus on RED Bar to buy. i.e PREFERABLY we buy when RED bar increase.
Example:-
If Banker’s Bar (Red Bar) crosses above 5 (25%) = Banker begins to build position
If Banker’s Bar > 10 (50%) = Banker already built positions. Price will start accelerate
If Banker’s Bar > 15 (75%) = Banker in control. Price will rocket
If Green colour is Retailer (Avoid)..
MCDX Plus comes with Moving Average
DEAD CROSS (shares down)
Banker’s MA cross below Retail’s MA
Banker’s MA cross below Hot Money’s MA
Hot Money’s MA cross below Retail’s MA
GOLDEN CROSS (shares up)
Banker’s MA cross above Retail’s MA
Banker’s MA cross above Hot Money’s MA
Hot Money’s MA cross above Retail’s MA
Contact me to find out more about Turtle Trading System and indicators
GMA BTC1D-BYBIT-SignalA specialised Moving Average Cross Strategy script
This script allows you to set up your own alerts for automated trading. Make sure to only trigger alerts on candle close
After having spent hours on backtesting various settings for the classic MA cross strategy, I have identified a highly efficient combination for the slow and fast MA length.
This particular indicator is is tailored to trade Bitcoin 1D on Bybit and I've simplified it by removing the option to change MA lengths.
As a reminder, the MA cross strategy produces the following signals:
- BUY when the Fast MA is crossing above the Slow MA
- SELL when the Fast MA is crossing below the Slow MA

IBS SignalsSimple Cross & Trend Confluence, request by Mr. IBS...
Cross:
STX = Stoc Cross
CDX = Candle Cross
MAX = MA Cross
MDX = Macd Cross
Trend Confluence:
Stoc Trend
Macd Trend
MA 9 Trend
Still need a lot of tuning up ..
Moving Average Daily (& Weekly) 50,100,200Free to use Moving Average indicator for 50, 100 and 200 days that displays both the daily and weekly Moving Averages on the same chart - revealing key support and resistance lines that might otherwise be overlooked. Please ensure to view in daily view only.
What is a Moving Average?
Smooths out the price across each period to reveal short, medium and long term trends and their relationship to each other. In principal, when the price is above a moving average the trend is up, when the price is below a moving average the trend is down.
When a short term MA crosses above a long term MA (a "golden cross") it is a strong buy signal. Conversely when a short term MA crosses below a long term MA (a "death cross") it is a strong sell signal. However, a death cross is usually only critical when both MAs are moving downwards.
Note that Moving Averages represent historical data and therefore are not strictly predictive in nature, but show trends that may be in action. Notably the 200 MA will often be particularly respected as support or resistance.
This tool is for educational purposes only and not a recommendation to buy or sell. Always do your own research before trading.

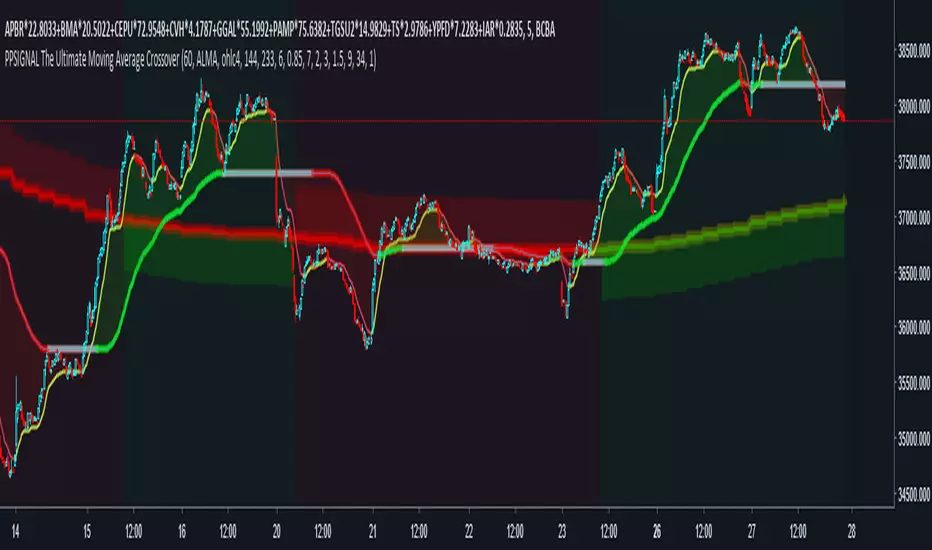
PpSignal The Ultimate Moving Average CrossoverNo matter how many times I explore new concepts, I tend to always incorporate a moving average, or two (if not on price, then on an oscillator). I am going to show the settings I have found to be most beneficial for finding the trend for the ES, forex, crypto etc. First, I have to admit, it is not just a simple crossover. Instead, it is a combination of a MA cross, Multi-Time Frame (MTF), and direction of a normalized moving average.
Add MA Crossing Method (short, medium, long) (D)Add three EMAs that are usually used in crossing tactics and alerts to signal buy/sell

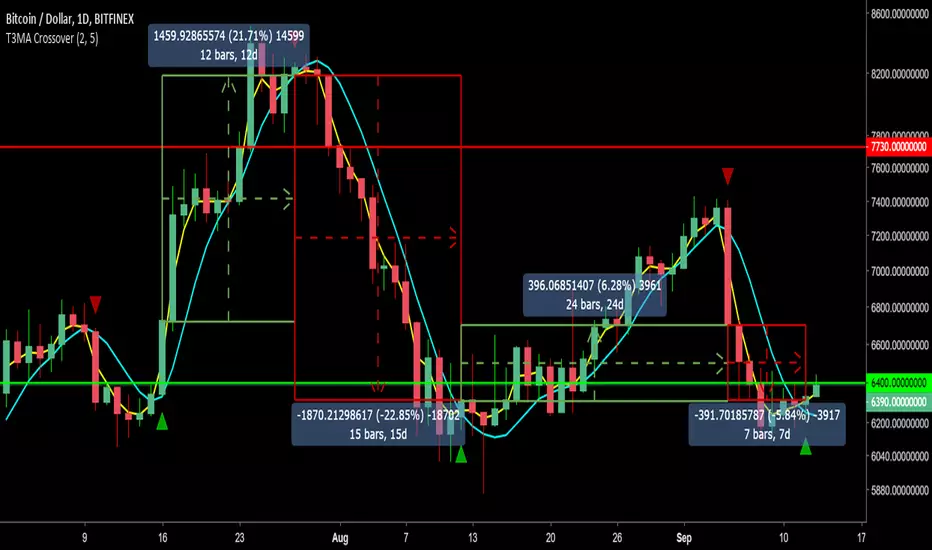
T3MA Crossover Strategy w/ Alerts v2.0Summary:
Using the T3MA formula developed by Tim Tillson, this differs from traditional SMA and EMA by providing a smoother curve and less lag. The smoothness is derived from the weighted sum of a single EMA through EMA 6 times.
How it works:
- Like any other crossover strategy.
- When fast MA crosses OVER the slow MA, go long.
- Close long and/or go short when the fast MA crosses UNDER the slow MA.
- Can keep flipping between long and short signals.
Quite a conservative strategy as it uses lagging indicators, not for intraday trading (you can, but I don't). Comes into it's own in trending markets as long as you stick to the signals.
Alert messages:
- Long
- Short
How I use it:
- My defaults are set at 2 fast MA and 5 slow MA to ride trends as close as possible.
- On BTCUSD and other altUSD pairs, I tend to use a daily time frame.
- On altBTC pairs, I tend to use a 12H time frame.
- Action on candle close at momentum confirmation (have seen numerous examples of a signal reversing mid candle into a dump).
Will need to be able to short altcoins to make the most of it, or it will at least keep you out of sustained downtrends (=/= holding).
Backtest it on bitcoin and other large cap alts on high time frames to see for yourself. For lazy trading, can set up alerts with AutoView.
0.1ETH for lifetime access. Message for details and support.
SMA Cross PreventionTraditional MA crossover indicators are reactive — they tell you a cross happened after the fact.
This indicator is prescriptive — it tells you exactly what price action is required to prevent a cross from happening.
The Core Insight
When a fast MA is above a slow MA but they're converging, traders ask: "Will we get a death cross?"
This indicator answers a more useful question:
"What is the minimum price path required to prevent the cross?"
By treating the MA structure as a constraint and solving for the required input (future prices), we transform a lagging indicator into a forward-looking risk assessment tool.

All-In-One Magnificent 7Here is a **complete, polished TradingView description** optimized for publication, clarity, SEO, and user onboarding — **fully compatible with Hidden Source Code mode**.
You can paste this directly into the *“Script Description”* section when publishing.
# **TradingView Description (Final Version)**
**Magnificent 7 Overall Percentage Change with MA, Angle, Icons & Threshold Alerts**
By **Andy Campillo** (TradingView: **readysetfire**)
© 2025 – All Rights Reserved
## **Overview**
This indicator tracks the **real-time combined percentage change** of the *Magnificent 7* stocks — AAPL, MSFT, AMZN, NVDA, TSLA, META, and GOOGL — and transforms their collective trend into a clear, actionable signal.
It provides instant insight into whether the market’s largest leadership group is **bullish, bearish, accelerating, weakening**, or undergoing meaningful volatility shifts.
This tool is designed for traders who want to:
* Monitor mega-cap market strength or weakness at a glance
* Confirm index momentum using underlying components
* Detect early trend shifts through MA angle acceleration
* Set actionable alerts without constantly watching the chart
## **Key Features**
### **1. Real-Time Magnificent 7 Percentage Change**
Aggregates the daily performance of the 7 most influential U.S. equities, creating a single smooth line that reflects broad market risk appetite.
Includes two modes:
* **Chart Timeframe Mode** (default – non-repainting, publication-safe)
* **1-Minute Real-Time Mode** (user-selectable)
### **2. Moving Average Trend Engine**
A fully customizable MA applied to the aggregated M7 data.
Includes:
* SMA / EMA / WMA / VWMA options
* Adjustable length
* Visual trend smoothing
### **3. MA Angle Detection (Acceleration Analysis)**
The indicator calculates the **slope angle** of the moving average and triggers:
* **Angle Up Events** (blue labels + upward arrows)
* **Angle Down Events** (orange labels + downward arrows)
This highlights moments where the M7 trend is **accelerating** or **decelerating**, providing an early trend confirmation or warning.
### **4. Background Bias Coloring**
The chart background automatically changes based on overall M7 performance:
* **Green background** → bullish aggregate performance
* **Red background** → bearish aggregate performance
Perfect for intraday visual bias.
### **5. Significant Change Alerts**
Users can enable alerts when the M7 line makes a **large bar-over-bar move**, indicating meaningful volatility or momentum shifts.
Configurable sensitivity.
### **6. Full Alert Suite Included**
Alerts available for:
✔ MA Crossover
✔ MA Crossunder
✔ Angle Up Event
✔ Angle Down Event
✔ Significant Change Threshold Break
✔ **Background Bias Shift (Bullish/Bearish)**
Every alert is optimized to fire only on proper confirmation.
## **Use Cases**
* Confirm index trades (SPX, QQQ, NQ, ES) by reading underlying mega-cap strength
* Detect early trend acceleration or weakening
* Spot market reversals via angle flips
* Automate alerts for regime shifts
* Validate market bias without scanning all seven stocks individually
This indicator is valuable for **day traders, swing traders, options traders, and futures traders**.
## **Notes & Disclaimer**
This script is provided for **educational purposes only** and does not constitute financial advice. Past performance does not guarantee future results. Always test any tool in a simulated environment before using it with real capital.
© 2025 Andy Campillo (TradingView: readysetfire).
Unauthorized copying, redistribution, or republishing of this indicator is strictly prohibited.

Magnificent 7 Basket This indicator is engineered for traders focused specifically on the seven most influential technology stocks (At the time of writing). It moves beyond single-asset analysis by establishing a sophisticated multi-factor validation system. Its primary mission is to filter out the noise and transient volatility of the local chart you are observing by determining whether the price action is fundamentally aligned with the coordinated capital flow driving Market Leadership (the Magnificent 7) and Global Risk Appetite (the U.S. Dollar Index, DXY).
The indicator achieves this by integrating three distinct data streams—local momentum, Mag 7 synchronized flow, and DXY context—into one final, powerful metric: the Self-Confirming Line (the Combined Plot). This line is a statistically refined score that provides the ultimate signal. It tells you, with high conviction, if the local move you are observing is merely an isolated event or is genuinely supported by coordinated capital deployment across the most influential assets in the market: Apple (AAPL), Microsoft (MSFT), Alphabet (GOOGL), Amazon (AMZN), Nvidia (NVDA), Tesla (TSLA), and Meta Platforms (META). This validation is crucial because trades that lack systemic backing are often high-risk, low-reward propositions.
Part I: The Alignment Philosophy – Systemic Context in Modern Markets
1. Market Leadership: The Magnificent 7 Index as a Capital Flow Barometer
The Mag 7 basket is not simply an aggregate of large stocks; it is the thermometer of risk appetite for the highest-value technology companies. Their collective momentum serves as a real-time proxy for the conviction of institutional capital managers.
The Necessity of Validation: When one of the seven stocks flashes a buy signal, the movement must be checked against the collective health of the Mag 7. If one stock is rising while the basket is stagnating or declining, the local move is likely based on short-term news or a temporary enthusiasm spike. Such moves often lack the institutional commitment required for sustained follow-through.
High-Conviction Bullish Confirmation: Imagine one of the seven stocks is completing a bullish pattern breakout. If the indicator confirms that the Mag 7 basket is simultaneously exceeding its adaptive volatility threshold (M7s signal), it signifies a coordinated "risk-on" movement. This confirms that the market leaders are validating the sentiment on your chart, greatly increasing the probability that the breakout will continue. The Self-Confirming Line will reflect this powerful alignment by spiking higher than the local Raw Line.
Contradiction and Caution (Bearish Warning): Conversely, if one of the seven stocks shows a deep, alarming pullback, but the Mag 7 basket is holding firm or showing synchronized positive inertia, the indicator issues a warning. The local pullback is likely a shallow, temporary correction that will quickly be bought up by liquidity flowing among the leaders. By identifying this contradiction, the Self-Confirming Line warns against premature bearish entries that are swimming against the overwhelming systemic current.
2. Global Risk Appetite: The DXY as the Inverse Barometer
The DXY (U.S. Dollar Index) measures the value of the dollar relative to a basket of six major foreign currencies. Because the Dollar is the world's primary reserve currency and a dominant component of global liquidity, its strength or weakness profoundly impacts risk assets, particularly the globally operating Magnificent 7 technology companies.
DXY Strength (The Headwind): A rising DXY signals a tightening of global liquidity, a shift toward safer assets, or the repatriation of capital. For U.S.-based technology giants with substantial international revenue, a strong DXY acts as a systemic Headwind. This structural drag can suppress equity prices even if local earnings news is good. The indicator uses this relationship to penalize the final sentiment score, cautioning you to reduce leverage or size.
DXY Weakness (The Tailwind): A falling DXY suggests greater risk tolerance and capital moving out of safe havens. This creates a powerful systemic Tailwind for the technology sector. The indicator magnifies the conviction score when the local price movement is aligned with this liquidity flow, validating the strength of the bullish move.
Part II: Core Mechanics and Calculation Detail – The Engine Room
The indicator is built upon a layered system of filters and adaptive calculations to produce a reliable, filtered signal.
1. The Basket Calculation and The Adaptive Threshold
The Mag 7 basket's external validation score is generated through a rigorous, multi-step calculation. This process ensures the signal is based on the aggregate quality of momentum, not just raw price movement.
A. Calculating the Basket Total Score (BTS)
Individual Component Fetch: The script first makes seven distinct request.security calls to simultaneously fetch the price data for each of the seven Magnificent 7 stocks, ensuring they are all synchronized to the current bar's close time.
Individual Quality Scoring: For each of the seven stocks, the system calculates a proprietary Momentum Quality Score. This score is based on the stock’s closing strength, its raw Moving Average divergence, and most importantly, its current RSI Strike Batch (detailed below). This step ensures poor-quality moves (e.g., short-lived, high-volume spikes that immediately reverse) do not contribute meaningfully to the basket’s total conviction.
Aggregation: The seven Individual Quality Scores are summed up to create the Basket Total Score (BTS). This BTS represents the instantaneous, aggregated momentum quality of the entire market leadership group.
Standard Deviation Context: The script then calculates the historical standard deviation (volatility) of the BTS over the user-defined Basket Adaptive Lookback. This provides the essential context: How significant is the current BTS movement relative to recent systemic volatility?
B. The M7 Labels (Statistical Significance + Quality Filter)
The M7 confirmation labels (M7s, M7m, M7w) that appear on the price bars are generated only when two conditions are met, acting as a two-factor authentication system for systemic strength: on the left of the labels is a number representing how many of the 7 stocks reached RSI on the viewable timeframe. These labels appear in blue below for buying and orange above in selling pressure.
Statistical Significance (Standard Deviation Check): The current Basket Total Score (BTS) must exceed its historical standard deviation by a defined multiple:
M7w (Weak/Initial): BTS > 1.0 Standard Deviation
M7m (Medium/Confirmation): BTS > 1.5 Standard Deviations
M7s (Strong/High Conviction): BTS > 2.0 Standard Deviations
RSI Quality Check (Accumulation Filter): The collective RSI Strike Batch Count (explained below) for the Mag 7 must indicate a measured accumulation rather than an exhaustion spike. The M7 label will only print on the bar if the combined RSI quality of the basket is within the desirable RSI Strike Batches (55-75). If the BTS is statistically significant (Condition 1) but the underlying RSI profile of the components suggests exhaustion (RSI > 80), the M7 label is suppressed, filtering out false-breakout signals.
The M7 label is thus a powerful confirmation: the move is statistically massive and structurally healthy.
2. RSI Strike Batches and Identifying "Hot Periods"
The core of the "Accumulation Filter" relies on proprietary RSI target ranges, called RSI Strike Batches, designed to find measured, persistent institutional flow as opposed to retail-driven extremes.
A. Defining RSI Strike Batches
Instead of treating the Relative Strength Index (RSI) as a binary overbought/oversold signal, the system uses distinct bands that correlate with different phases of large capital deployment:
RSI Range (Batch)
Interpretation
Momentum Quality
55-65
Early Accumulation/Distribution
The first phase of clear directional bias. Large capital actively establishing positions. This is the highest momentum zone.
65-75
Sustained Trend/Mid-Cap Deployment
Strong follow-through. Trend continuation is confirmed, but liquidity is starting to thin.
75-80
Late-Stage Euphoria/Liquidity Trap
Price is nearing exhaustion. The risk of quick reversal is high. This range penalizes the score.
B. The "Hot Period" Confirmation
A Hot Period is identified when a significant number of Mag 7 components are simultaneously operating within the highest quality momentum zones (RSI 55-65 or 65-75).
Detection: The indicator counts how many of the seven stocks fall into these bullish or bearish strike batches on the current bar.
Conviction Magnification: When, for example, four or more of the Mag 7 stocks are simultaneously in the RSI 55-65 Bullish Strike Batch, it signals synchronized, coordinated capital deployment across the sector. This is a true "Hot Period" of high institutional conviction.
Signal Output: When a Hot Period is detected, the external validation score (which feeds into the Self-Confirming Line) is magnified significantly. This prevents the system from generating high-conviction signals during periods when all the leaders are simply exhibiting exhausted overbought (RSI > 80) conditions, ensuring trades are entered during the measured, sustained phase of accumulation.
Part III: Interpreting the Sentiment Plot Lines – Alignment and Divergence
The indicator plots two distinct lines at the bottom of the chart. Mastering the interplay between these two plots is the key to trading with the indicator.
Sentiment Line
Data Source
Interpretation Focus
Key Use Case
AAI Sentiment Index (The Raw Line)
Internal to the current chart only.
Local Momentum. Measures the asset's own strength, volatility, and internal MA crosses.
Identifying early, pre-validated trade setups, confirming local divergences (e.g., price higher, Raw Line lower).
Self-Confirming Line (The Combined Plot)
Raw Line + Mag 7 Score + DXY Weight.
Systemic Alignment. The final, filtered score validated by external market leadership and global risk context.
The primary signal for trade entry/exit confirmation, position sizing, and determining true conviction.
A. High-Conviction Alignment (The Trade Confirmation)
High-conviction trades occur when the two lines move in synchronized fashion, with the Self-Confirming Line leading or sustaining a level significantly higher than the Raw Line.
Example: High-Conviction Long Entry:
Raw Line Fires: Your local chart begins to move up, and the Raw Line (local momentum) breaks above the centerline. This is your initial setup alert.
Self-Confirming Line Confirms: The Self-Confirming Line immediately follows, not just crossing the centerline, but often exceeding the Raw Line's initial height. This powerful action confirms the Mag 7 leaders are providing a strong synchronized push (M7s signal likely fired, confirming a Hot Period).
Action: This is the ideal moment for a confirmed trade entry, allowing for larger position sizing and a higher expectation of follow-through.
B. Cautionary Divergence (The Risk Filter)
Divergence occurs when the two lines fail to agree, signaling a disconnect between the local price action and the systemic market support.
Example: Bearish Trap Divergence (A Long Warning):
Raw Line Fires Strongly: Your local asset is rocketing up, and the Raw Line spikes to an extreme high (e.g., +80).
Self-Confirming Line Lags: Despite the local spike, the Self-Confirming Line remains flat, moves only slightly, or—critically—starts declining.
Interpretation: This is a severe warning. The local spike is likely a short-term liquidity event. The other six Mag 7 leaders are not confirming this move, or the DXY is suddenly acting as a Headwind. The system is telling you: "The market is not buying this move."
Action: Avoid entering long, or significantly reduce position size. This pattern often precedes a sharp reversal or a failed breakout.
Part IV: Deep Dive into Setting Customization – Adapting to Your Asset
1. AAI Sentiment Weight (% - Balance Slider)
This controls the balance of importance between the local chart's internal momentum and the external indices' input.
Focusing on Individual Stock Volatility (TSLA, NVDA):
Goal: Focus primarily on the local chart's own volatile swings, using the external data as a soft, contextual filter.
Action: Increase the AAI Sentiment Weight (e.g., 70-80%). This forces the Self-Confirming Line to closely track the Raw AAI Line.
Trading Stable, High-Cap Leaders (AAPL, MSFT):
Goal: Demand strong external validation for every signal. Ensure that movement is overwhelmingly validated by the other Mag 7 members.
Action: Decrease the AAI Sentiment Weight (e.g., 20-30%). The Self-Confirming Line becomes heavily influenced by the Mag 7 Basket Momentum Score.
2. Individual Stock MA Weight (% - Basket Importance)
This setting determines the proportional importance of the Mag 7 basket score within the total external component of the calculation.
High Weight: When trading one of the Mag 7 stocks that is highly sensitive to the overall basket flow. This ensures signals fire with high conviction only when the leadership stocks are aligned.
Lower Weight: When focusing on stock-specific news events that temporarily decouple one stock from the other six. The Mag 7 momentum will still be measured, but its influence on the Self-Confirming Line will be significantly reduced, allowing the local momentum to be more dominant in the final validated score.
Part V: Execution and Auxiliary Tools
1. The Dynamic Strike Price Line
This line is calculated as a function of the current Self-Confirming Line's magnitude and the user-defined Target Price Multiplier (%). It does not represent a static resistance level, but rather a dynamic projection of where price should travel given the current level of confirmed, systemic momentum.
2. Adaptive Brightness Range Lines (Dynamic Support/Resistance)
These dynamic support and resistance zones are derived from recent high-volume pivots and short-term volatility envelopes. Their key innovation is a visual cue tied to volatility: the closer the price approaches a range boundary, the brighter the line becomes. This provides an immediate visual warning that the asset is entering a high-probability reversal, consolidation, or test zone.
3. PoS Trend Projection (Probability of Success Filter)
This is a forward-looking trend line that is governed by the internal Probability of Success (PoS) filter. The line uses the validated sentiment to project the likely path of price over the next few bars. The line disappears when conditions are uncertain or contradictory.
Part VI: Screen Clarity and Toggling Features for Focused Analysis
The indicator provides granular visibility controls to ensure the raw price action is never obscured. You can toggle off auxiliary features to allow the trader to focus solely on the primary instrument and the final, most crucial signal: the Self-Confirming Line.
Achieving a Minimalist View by Toggling Features Off
For a clean chart, you can disable the following:
Show Adaptive Brightness Range Lines: Removes the dynamic support/resistance lines.
Show Strike Price Line: Removes the dynamic take-profit/invalidation line.
Show PoS Trend Projection: Removes the forward-looking trend line.
Show M7 Confirmation Labels: Removes the M7s, M7m, and M7w labels that appear directly above or below the price candles. By toggling these off, you rely purely on the magnitude of the Self-Confirming Line in the bottom pane for your M7 confirmation.
This leaves you with a focused view of the price action and the Self-Confirming Line, which is the final, validated, systemic conviction score.
This is a request for access script.
Always trade with risk control, do your own research, exercise market awareness.

Stockbee 8% 4% 9M + MA CrossoversThis is another version of my Stockbee 9% 4% 9M script, now enhanced with moving average crossovers to highlight trend shifts more effectively.
The crossovers are displayed in the same visual style as the 9 million volume indicator from the original script but use different shapes and forms for better distinction.
All crossover visuals can be customized to your liking—you can adjust their appearance to fit your charting style or preference.

Relative Strength (RS) By @Byte2Bull📈 Relative Strength (RS) By @Byte2Bull
📌 Overview
This indicator plots a Relative Strength (RS) line that compares the performance of the chart symbol to any benchmark symbol (index, ETF, or stock). By comparing the stock’s price movement to that of the benchmark, this tool highlights whether a stock is outperforming or underperforming the market.
RS value = (Price of symbol / Price of benchmark) × 100
It highlights hidden leaders and emerging strength through dynamic line plots, customizable moving average, and powerful new high detection features, enabling more informed trading decisions.
🛠 Key Features
⦿ Custom Benchmark Selection
Compare any stock with your chosen benchmark (default: NSE:NIFTYMIDSML400), such as NIFTY50, BANKNIFTY, or sector indices.
⦿ Relative Strength Line with Dynamic Coloring
Green when RS is above its moving average (strength/outperformance).
Red when RS is below its moving average (weakness/underperformance).
⦿ Configurable Moving Average
Apply either EMA or SMA over RS with customizable length. This helps smooth out volatility and provides a clear reference trend.
⦿ New High Detection
Marks when RS makes a new high.
Highlights when RS makes a new high before price does → a powerful early signal of hidden strength.
⦿ MA Crossover
Optional marker for when RS crosses above its moving average, signaling potential start of leadership.
⦿ Visual Enhancements
Adjustable line thickness.
Fill area between RS and its MA with green/red shading for quick interpretation.
Customizable colors for all key signals.
⦿ Built-in Alerts
Set alerts for:
RS New High
RS New High Before Price
Bullish MA Crossover
🎯 How to Use
⦿ Identify Market Leaders:
A stock with RS consistently above its MA is likely leading the market.
⦿ Spot Early Strength:
If RS makes a new high before the stock price, it may signal strong relative demand — often preceding breakouts.
⦿ Filter Weakness:
Stocks with RS below the MA are lagging and may be best avoided during bullish phases.
⦿ Combine with Price Action & Volume:
RS works best alongside price breakouts, trend analysis, and volume confirmations.

THOR SignalTHOR Signal Indicator
Trend Regime Detection via Volatility-Normalized Acceleration Scoring
The THOR Signal Indicator classifies market direction into “long-favorable” or “short/risk-off” regimes using a three-layer signal process that adapts to volatility, momentum strength, and directional consistency. This script is specifically designed for swing traders looking to reduce false positives during choppy or trendless periods.
⸻
How It Works
THOR does not use standard technical indicators like RSI, MACD, or moving average crossovers. Instead, it creates a composite signal using three custom-calculated conditions:
1. Volatility-Normalized Price Deviation:
• Measures how far price has moved relative to recent volatility.
• Helps distinguish between meaningful trend movement and noise.
2. Directional Acceleration Score:
• Calculates the second derivative (rate of change of momentum) of a smoothed trend backbone.
• Signals regime shifts only when acceleration exceeds a dynamic threshold.
3. Persistence Filter:
• Applies a custom smoothing layer (similar to a Kalman filter) to confirm that directional strength is sustainable and not short-term whipsaw.
• Filters out one-bar momentum spikes.
A signal is plotted only when all three layers agree:
• Green dot = Long-side favorable regime
• Red dot = Short-side or risk-off regime
⸻
Why This Is Different
Unlike standard momentum tools that rely on fixed thresholds (like RSI overbought/oversold levels), THOR dynamically adapts its regime criteria based on the asset’s own behavior. It avoids laggy confirmation signals by using real-time volatility conditioning and trend persistence scoring.
It is not a mashup of public indicators. No MA crossovers, Bollinger Bands, or known oscillator logic is used. The architecture is original and built entirely from low-level functions and mathematical modeling.
⸻
How to Use It
• Best timeframes: Weekly, Daily, or Renko
• Use bar-close confirmation only (do not trade intrabar signals)
• Green dot: Consider long position or hold existing longs
• Red dot: Consider exiting longs or entering defensive stance
• Use with existing risk management and discretionary context
⸻
Use Case
• Swing trade filter
• Trend regime switch detector
• Allocation toggling (risk-on vs risk-off)
⸻
Disclosures
This is a closed-source script. Logic has been explained conceptually to comply with TradingView script publishing policies. No proprietary code is exposed. The tool is not intended as financial advice and does not guarantee accuracy or profitability.

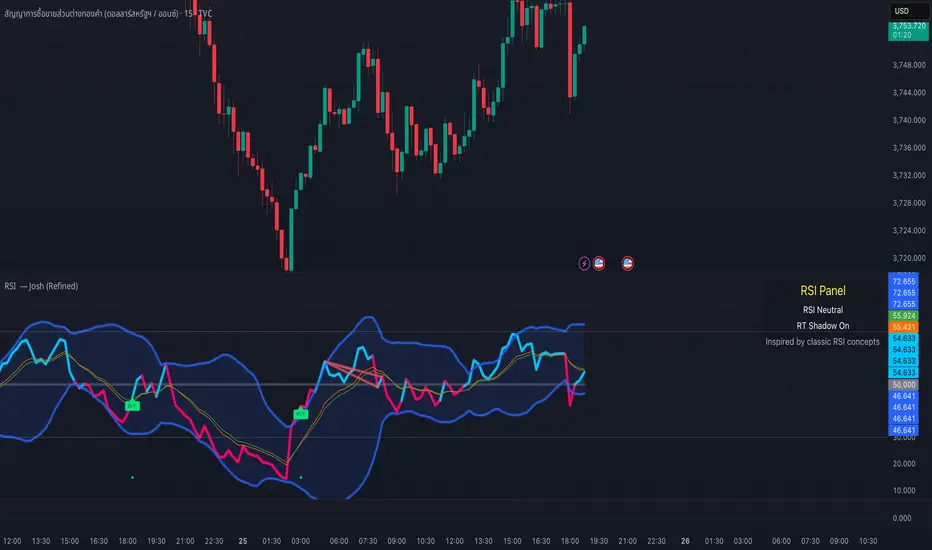
RSI — Josh (Refined)RSI Buy/Sell Pro — Josh (Refined)
Overview
This study enhances the classic RSI (Relative Strength Index) by adding multiple visualization layers and research tools. It helps users see overbought/oversold conditions, divergence patterns, and momentum shifts more clearly — in a way that is visually intuitive.
⚠️ Disclaimer: This script is for educational and research purposes only. It does not provide financial advice or trading recommendations. Past signals are not indicative of future results. Users remain fully responsible for their own decisions and risk management.
Key Features
Custom RSI Signals
Flexible signal modes (Strict 30/70, Loose, Aggressive 50-cross)
Optional “BUY/SELL” visual text or compact labels
Adjustable cooldown between signals
RSI Divergence Detection
Classic bullish/bearish divergence with pivot confirmation
Real-time “Shadow Divergence” preview (may repaint, by design)
Visual waterline and shaded shadow effects
MA Cross on RSI
Overlay fast/slow moving averages directly on the RSI scale
Crossovers highlighted with markers and alerts
Bollinger Aura (Glow Effect)
Bollinger Bands applied to RSI with customizable color modes
Single color, Upper/Lower, or Zone-driven bull/bear tint
Optional soft fill between bands for clarity
Guidance Panel
On-chart panel summarizing RSI state (OB/OS/Neutral), real-time shadow status, and credits
Alerts Included
RSI BUY / SELL cross conditions
RSI MA cross up / down
Divergence signals (classic & real-time)
Usage Notes
Designed to visualize RSI dynamics and assist in technical research
The “BUY/SELL” markers are visual study tags only — not trade calls
For best practice, combine with higher timeframe context, support/resistance, or volume analysis
Always validate ideas in a demo environment before applying to live trading
Compliance & Credits
Built in Pine Script® v5 on TradingView
Indicator name and labels are for visualization only — not investment advice
Credits: Inspired by classic RSI concepts, refined with additional visualization methods
✅ This description keeps your script compliant:
No performance guarantees
No marketing language like “make profit fast”
Clear disclaimer & educational framing
RSI MA Cross + Divergence Signal (V2) Core Logic
RSI + Moving Average
The script calculates a standard RSI (default 14).
It then overlays a moving average (SMA/EMA/WMA, default 9).
When RSI crosses above its MA → bullish momentum.
When RSI crosses below its MA → bearish momentum.
Divergence Filter
Signals are only valid if there’s confirmed divergence:
Bullish divergence: Price makes a lower low, RSI makes a higher low.
Bearish divergence: Price makes a higher high, RSI makes a lower high.
Overbought / Oversold Filter
Optional extra:
Bullish signals only valid if RSI ≤ 30 (oversold).
Bearish signals only valid if RSI ≥ 70 (overbought).
This ensures signals happen in “stretched” conditions.
Risk & Trade Management
Entries taken only when all conditions align.
Exits can be managed with ATR stops, partial take-profits, breakeven moves, and trailing stops (we coded these in the strategy version).
Cooldown, session filters, and daily loss guard to keep risk tight.
🔹 Strengths
✅ High selectivity: Combining RSI cross + divergence + OB/OS means signals are rare but higher quality.
✅ Great at catching reversals: Divergence highlights where price may be running out of steam.
✅ Risk management baked in: ATR stops + partial exits smooth out equity curve.
✅ Works across markets: ES, FX, crypto — anywhere RSI divergences are respected.
✅ Flexible: You can loosen/tighten filters depending on aggressiveness.
🔹 Weaknesses
❌ Lag from pivots: Divergence only confirms after a few bars → you enter late sometimes.
❌ Choppy in ranges: In sideways markets, RSI divergences appear often and whipsaw.
❌ Filters reduce signals: With all filters ON (divergence + OB/OS + trend + session), signals can be very rare — may under-trade.
❌ Not standalone: Needs higher-timeframe context (trend, liquidity pools) to avoid counter-trend entries.
🔹 Best Ways to Trade It
Use Higher Timeframe Bias
Run the strategy on 15m/1H, but only trade in direction of higher timeframe trend (e.g., 4H EMA).
Example: If daily is bullish → only take bullish divergences.
Pair With Structure
Look for signals at key zones: HTF support/resistance, VWAP, or FVGs.
Divergence + RSI cross inside an FVG is a strong entry trigger.
Adjust OB/OS for Volatility
For crypto/FX: use 35/65 instead of 30/70 (markets trend harder).
For ES/S&P: 30/70 works fine.
Risk Management Is King
Use partial exits: take profit at 1R, trail rest.
Size by % of equity (we coded this into the strategy).
Avoid News Spikes
Divergences break down around CPI, NFP, Fed announcements — stay flat.
🔹 When It Shines
Trending markets that make extended pushes → clean divergences.
Reversal zones (oversold → bullish bounce, overbought → bearish fade).
Swing trading (15m–4H) — less noise than 1m/5m scalping.
🔹 When to Avoid
Low volatility chop → lots of false divergences.
During high-impact news → RSI swings wildly.
In strong one-way trends without pullbacks — divergence keeps calling tops/bottoms too early.
✅ Summary:
This is a reversal-focused RSI divergence strategy with strict filters. It’s powerful when combined with higher-timeframe bias + structure confluence, but weak if traded blindly in choppy or news-driven conditions. Best to treat it as a precision entry trigger, not a full system — layer it on top of your FVG/ORB framework for maximum edge.

Smooth BTCSPL [GiudiceQuantico] – Dual Smoothed MAsSmooth BTCSPL – Dual Smoothed MAs
What it measures
• % of Bitcoin addresses in profit vs loss (on-chain tickers).
• Spread = profit % − loss % → quick aggregate-sentiment gauge.
• Optional alpha-decay normalisation ⇒ keeps the curve on a 0-1 scale across cycles.
User inputs
• Use Alpha-Decay Adjusted Input (true/false).
• Fast MA – type (SMA / EMA / WMA / VWMA) & length (default 100).
• Slow MA – type & length (default 200).
• Colours – Bullish (#00ffbb) / Bearish (magenta).
Computation flow
1. Fetch daily on-chain series.
2. Build raw spread.
3. If alpha-decay enabled:
alpha = (rawSpread − 140-week rolling min) / (1 − rolling min).
4. Smooth chosen base with Fast & Slow MAs.
5. Bullish when Fast > Slow, bearish otherwise.
6. Bars tinted with the same bull/bear colour.
How to read
• Fast crosses above Slow → rising “addresses-in-profit” momentum → bullish bias.
• Fast crosses below Slow → stress / capitulation risk.
• Price-indicator divergences can flag exhaustion or hidden accumulation.
Tips
• Keep in a separate pane (overlay = false); bar-colouring still shows on price chart.
• Shorter lengths for swing trades, longer for macro outlook.
• Combine with funding rates, NUPL or simple price-MA crossovers for confirmation.

Canuck Trading IndicatorOverview
The Canuck Trading Indicator is a versatile, overlay-based technical analysis tool designed to assist traders in identifying potential trading opportunities across various timeframes and market conditions. By combining multiple technical indicators—such as RSI, Bollinger Bands, EMAs, VWAP, MACD, Stochastic RSI, ADX, HMA, and candlestick patterns—the indicator provides clear visual signals for bullish and bearish entries, breakouts, long-term trends, and options strategies like cash-secured puts, straddles/strangles, iron condors, and short squeezes. It also incorporates 20-day and 200-day SMAs to detect Golden/Death Crosses and price positioning relative to these moving averages. A dynamic table displays key metrics, and customizable alerts help traders stay informed of market conditions.
Key Features
Multi-Timeframe Adaptability: Automatically adjusts parameters (e.g., ATR multiplier, ADX period, HMA length) based on the chart's timeframe (minute, hourly, daily, weekly, monthly) for optimal performance.
Comprehensive Signal Generation: Identifies short-term entries, breakouts, long-term bullish trends, and options strategies using a combination of momentum, trend, volatility, and candlestick patterns.
Candlestick Pattern Detection: Recognizes bullish/bearish engulfing, hammer, shooting star, doji, and strong candles for precise entry/exit signals.
Moving Average Analysis: Plots 20-day and 200-day SMAs, detects Golden/Death Crosses, and evaluates price position relative to these averages.
Dynamic Table: Displays real-time metrics, including zone status (bullish, bearish, neutral), RSI, MACD, Stochastic RSI, short/long-term trends, candlestick patterns, ADX, ROC, VWAP slope, and MA positioning.
Customizable Alerts: Over 20 alert conditions for entries, exits, overbought/oversold warnings, and MA crosses, with actionable messages including ticker, price, and suggested strategies.
Visual Clarity: Uses distinct shapes, colors, and sizes to plot signals (e.g., green triangles for bullish entries, red triangles for bearish entries) and overlays key levels like EMA, VWAP, Bollinger Bands, support/resistance, and HMA.
Options Strategy Signals: Suggests opportunities for selling cash-secured puts, straddles/strangles, iron condors, and capitalizing on short squeezes.
How to Use
Add to Chart: Apply the indicator to any TradingView chart by selecting "Canuck Trading Indicator" from the Pine Script library.
Interpret Signals:
Bullish Signals: Green triangles (short-term entry), lime diamonds (breakout), blue circles (long-term entry).
Bearish Signals: Red triangles (short-term entry), maroon diamonds (breakout).
Options Strategies: Purple squares (cash-secured puts), yellow circles (straddles/strangles), orange crosses (iron condors), white arrows (short squeezes).
Exits: X-cross shapes in corresponding colors indicate exit signals.
Monitor: Gray circles suggest holding cash or monitoring for setups.
Review Table: Check the top-right table for real-time metrics, including zone status, RSI, MACD, trends, and MA positioning.
Set Alerts: Configure alerts for specific signals (e.g., "Short-Term Bullish Entry" or "Golden Cross") to receive notifications via TradingView.
Adjust Inputs: Customize input parameters (e.g., RSI period, EMA length, ATR period) to suit your trading style or market conditions.
Input Parameters
The indicator offers a wide range of customizable inputs to fine-tune its behavior:
RSI Period (default: 14): Length for RSI calculation.
RSI Bullish Low/High (default: 35/70): RSI thresholds for bullish signals.
RSI Bearish High (default: 65): RSI threshold for bearish signals.
EMA Period (default: 15): Main EMA length (15 for day trading, 50 for swing).
Short/Long EMA Length (default: 3/20): For momentum oscillator.
T3 Smoothing Length (default: 5): Smooths momentum signals.
Long-Term EMA/RSI Length (default: 20/15): For long-term trend analysis.
Support/Resistance Lookback (default: 5): Periods for support/resistance levels.
MACD Fast/Slow/Signal (default: 12/26/9): MACD parameters.
Bollinger Bands Period/StdDev (default: 15/2): BB settings.
Stochastic RSI Period/Smoothing (default: 14/3/3): Stochastic RSI settings.
Uptrend/Short-Term/Long-Term Lookback (default: 2/2/5): Candles for trend detection.
ATR Period (default: 14): For volatility and price targets.
VWAP Sensitivity (default: 0.1%): Threshold for VWAP-based signals.
Volume Oscillator Period (default: 14): For volume surge detection.
Pattern Detection Threshold (default: 0.3%): Sensitivity for candlestick patterns.
ROC Period (default: 3): Rate of change for momentum.
VWAP Slope Period (default: 5): For VWAP trend analysis.
TradingView Publishing Compliance
Originality: The Canuck Trading Indicator is an original script, combining multiple technical indicators and custom logic to provide unique trading signals. It does not replicate existing public scripts.
No Guaranteed Profits: This indicator is a tool for technical analysis and does not guarantee profits. Trading involves risks, and users should conduct their own research and risk management.
Clear Instructions: The description and usage guide are detailed and accessible, ensuring users understand how to apply the indicator effectively.
No External Dependencies: The script uses only built-in Pine Script functions (e.g., ta.rsi, ta.ema, ta.vwap) and requires no external libraries or data sources.
Performance: The script is optimized for performance, using efficient calculations and adaptive parameters to minimize lag on various timeframes.
Visual Clarity: Signals are plotted with distinct shapes and colors, and the table provides a concise summary of market conditions, enhancing usability.
Limitations and Risks
Market Conditions: The indicator may generate false signals in choppy or low-liquidity markets. Always confirm signals with additional analysis.
Timeframe Sensitivity: Performance varies by timeframe; test settings on your preferred chart (e.g., 5-minute for day trading, daily for swing trading).
Risk Management: Use stop-losses and position sizing to manage risk, as suggested in alert messages (e.g., "Stop -20%").
Options Trading: Options strategies (e.g., straddles, iron condors) carry unique risks; consult a financial advisor before trading.
Feedback and Support
For questions, suggestions, or bug reports, please leave a comment on the TradingView script page or contact the author via TradingView. Your feedback helps improve the indicator for the community.
Disclaimer
The Canuck Trading Indicator is provided for educational and informational purposes only. It is not financial advice. Trading involves significant risks, and past performance is not indicative of future results. Always perform your own due diligence and consult a qualified financial advisor before making trading decisions.

ReadyFor401ks Just Tell Me When!ReadyFor401ks Just Tell Me When!
LET ME START BY SAYING. NO INDICATOR WILL HELP YOU NAIL THE PERFECT ENTRY/EXIT ON A TRADE. YOU SHOULD ALWAYS EDUCATE YOURSELF AND HAVE A BASIC UNDERSTANDING OF INVESTING, TRADING, CHART ANALYSIS, AND THE RISKS INVOLVED WITH. THAT BEING SAID, WITH THE RIGHT ADJUSTMENTS, IT'S PRETTY D*$N CLOSE TO PERFECTION!
This indicator is designed to help traders identify t rend direction, continuation signals, and potential exits based on a dynamic blend of moving averages, ATR bands, and price action filters. Whether you’re an intraday trader scalping the 5-minute chart or a swing trader analyzing the weekly timeframe for LEAPS , this tool provides a clear, rule-based system to help guide your trading decisions.
⸻
Key Features & Benefits
🔹 Customizable Trend Power (Baseline) Calculation
• Choose from JMA, EMA, HMA, TEMA, DEMA, SMA, VAMA, and WMA for defining your baseline trend direction.
• The baseline helps confirm whether the market is in a bullish or bearish phase.
🔹 ATR-Based Trend Continuation & Volatility Measurement
• ATR bands dynamically adjust to market conditions, helping you spot breakouts and fakeouts.
• The indicator detects when price violates ATR range , which often signals impulse moves.
🔹 Clear Entry & Exit Signals
• Uses a Continuation MA (SSL2) to confirm trends.
• Includes a separate Exit MA (SSL3) that provides crossover signals to indicate when to exit trades or reverse positions .
• Plots trend continuation circles when ATR conditions align with trend signals.
🔹 Keltner Channel Baseline for Market Structure
• A modified Keltner Channel is integrated into the baseline to help filter out choppy conditions .
• If price remains inside the baseline, the market is in consolidation , while breakouts beyond the bands indicate strong trends .
🔹 Adaptive Color Coding for Market Conditions
• Bars change color based on momentum, making trend direction easy to read.
• Green = Bullish Trend, Red = Bearish Trend, Gray = Neutral/Chop.
🔹 Flexible Alerts for Trade Management
• Get real-time alerts when the Exit MA crosses price , helping you l ock in profits or switch directions .
⸻
How to Use This Indicator for Different Trading Styles
🟢 For Intraday Trading (5-Minute Chart Setup)
• Faster MA settings help react quickly to momentum shifts.
• Ideal for scalping breakouts, trend continuation setups, and intraday reversals.
• Watch for ATR violations and price interacting with the baseline/Keltner Channel for entries.
--------------------------------
My Settings for Intraday Trading on 5min Chart
ATR Period: 15
ATR Multi: 1
ATR Smoothing: WMA
Trend Power based off of: JMA
Trend Power Period: 30
Continuation Type: JMA
Continuation Length: 20
Calculate Exit of what MA?: HMA
Calculate Exit off what Period? 30
Source of Exit Calculation: close
JMA Phase *APPLIES TO JMA ONLY: 3
JMA Power *APPLIES TO JMA ONLY: 3
Volatility Lookback Period *APPLIES TO VAMA ONLY 30
Use True Range for Channel? Checked
Base Channel Multiplier: 0.4
ATR Continuation Criteria: 1.1
----------------------------------
🔵 For Swing Trading & LEAPS (Weekly Chart Setup - Default Settings)
• Slower MAs provide a broader view of trend structure.
• Helps capture multi-week trend shifts and confirm entry points for longer-term trades.
• Weekly ATR bands highlight when stocks are entering overextended conditions.
💡 Example:
Let’s say you’re looking at TSLA on a Weekly Chart using the default settings. You notice that price crosses above the continuation MA (SSL2) while remaining above the baseline (trend power MA). The bar turns green, and price breaks above ATR resistance, signaling a strong bullish continuation. This could be a great opportunity to enter a long-term swing trade or LEAPS options position.
On the flip side, if price reverses below the Exit MA (SSL3) and turns red while breaking the lower ATR band, it might signal a good time to exit longs or enter a short trade.
⸻
Final Thoughts
The ReadyFor401ks Just Tell Me When! indicator is an all-in-one trading system that simplifies trend-following, volatility measurement, and trade management. By integrating multiple moving average types, ATR filters, and clear visual cues, it allows traders to stay disciplined and remove emotions from their trading decisions.
✅ Perfect for scalpers, day traders, and swing traders alike!
🔔 Set up alerts for automated trade signals and never miss a key move!
💬 If you find this indicator useful, leave a comment and share how you use it in your trading! 🚀

Enhanced VIP-like IndicatorSettings Breakdown Tutorial: Optimizing a Trading Strategy
This guide explains the key trading strategy settings and how to customize them based on your trading style and goals. Each parameter is essential for tailoring the strategy to market conditions and your risk appetite.
1. Short Moving Average Length (Default: 9)
• Purpose: Tracks short-term trends using a small number of candles.
• Settings Tips:
• Smaller Values (e.g., 9): Quickly react to price changes, useful for fast-moving markets.
• Larger Values (e.g., 12-15): Generate smoother signals for less volatile trades.
2. Long Moving Average Length (Default: 21)
• Purpose: Identifies long-term trends.
• Settings Tips:
• Higher Values (e.g., 50): Spot broader trends at the expense of slower signals.
• Trend Analysis: The interaction of short and long MAs helps determine bullish or bearish trends (e.g., bullish when short MA crosses above long MA).
3. Higher Timeframe MA Length (Default: 200)
• Purpose: Filters long-term trends on a higher timeframe (e.g., daily).
• Settings Tips:
• 200 Periods: Standard for defining bullish (price above) or bearish (price below) markets.
• Adjustable: Use 100 for faster responses or stick with 200 for reliability.
4. Higher Timeframe (Default: 1 Day)
• Purpose: Defines the timeframe for the higher moving average.
• Settings Tips:
• Shorter Timeframes (e.g., 4 Hours): More frequent trading signals.
• Daily Timeframe: Best for swing trading and identifying macro trends.
5. RSI Length (Default: 14)
• Purpose: Measures momentum over a specific number of candles.
• Settings Tips:
• Lower Values (e.g., 7): More sensitive to price changes, ideal for quick trades.
• Higher Values (e.g., 20): Smooth signals for more stable markets.
6. RSI Overbought (70) and Oversold (30) Levels
• Purpose: Marks thresholds for overbought and oversold conditions.
• Settings Tips:
• Stricter Levels (e.g., 80/20): Fewer, higher-quality signals.
• Looser Levels (e.g., 65/35): More frequent signals, suitable for active trading.
7. Pivot Left Bars (5) and Pivot Right Bars (5)
• Purpose: Confirms pivot points (support/resistance) based on surrounding candles.
• Settings Tips:
• Higher Values (e.g., 10): Stronger but less frequent pivot points.
• Lower Values: More responsive, for traders seeking quick pivots.
8. Take Profit Percentage (Default: 2%)
• Purpose: Defines the profit level to exit trades.
• Settings Tips:
• Higher Values (e.g., 5%): For swing traders holding positions longer.
• Lower Values (e.g., 1%): For scalpers focusing on quick trades.
9. Minimum Volume (Default: 1,000,000)
• Purpose: Ensures sufficient liquidity for trading.
• Settings Tips:
• Lower Values: For lower-volume markets.
• Higher Values: Reduces risk in high-liquidity assets.
10. Stop Loss Percentage (Default: 1%)
• Purpose: Sets the maximum acceptable loss per trade.
• Settings Tips:
• Lower Values (e.g., 0.5%): Reduces risk, suited for conservative trading.
• Higher Values (e.g., 2%): Allows more price fluctuation, ideal for volatile markets.
11. Entry Conditions
• Options:
• MA Crossover & RSI: Combines trend-following and momentum for well-rounded signals.
• Pivot Breakout: Focuses on support/resistance breakouts for high-impact trades.
• Settings Tips:
• Trend-Following Traders: Use MA Crossover & RSI.
12. Exit Conditions
• Options:
• Opposite Signal: Exits when the trade’s opposite condition occurs (e.g., bullish to bearish).
• Fixed Take Profit/Stop Loss: Exits based on predefined profit/loss thresholds.
• Settings Tips:
• Opposite Signal: Ideal for trend-following strategies.
Summary
Customizing these settings aligns the strategy with your trading goals. Test configurations in a demo environment before live trading to refine the approach and optimize results. Always balance profit potential with risk management.
• Fixed Levels: Better for strict risk management.
• Breakout Traders: Opt for Pivot Breakout.

OBV + Custom MA StrategyFor a long time, the use of the OBV indicator has been relatively monotonous, with its expression and content lacking diversity. Therefore, I'm considering trying new ways of representation.
This "OBV + Custom MA Strategy" indicator combines the On-Balance Volume (OBV) with customizable moving averages (SMA, EMA, or WMA) to provide advanced insights into market trends. The indicator calculates OBV manually and overlays two moving averages: a short-term and a long-term MA. Key features include:
OBV plotted alongside short-term and long-term moving averages for better trend visualization.
Signals generated when OBV crosses the short-term MA or when the short-term MA crosses the long-term MA.
Alerts for bullish and bearish crossovers to help identify potential buy or sell opportunities.
This indicator is suitable for traders looking to incorporate volume dynamics into their strategy while customizing their moving average type and periods.
中文说明
此“OBV + 自定义均线策略”指标结合了成交量指标OBV与可定制的移动均线(SMA、EMA或WMA),为市场趋势分析提供了更多的视角。该指标手动计算OBV,并叠加短期与长期均线,主要特点包括:
绘制OBV以及短期和长期均线,以更清晰地观察趋势。
当OBV上穿/下穿短期均线或短期均线上穿/下穿长期均线时,生成买卖信号。
提供多种看涨和看跌信号的警报,帮助识别潜在的买入或卖出机会。
此指标适合希望将成交量动态纳入策略的交易者,并支持自定义均线类型和周期以满足个性化需求。